
What is an FSH Levels Chart?
Follicle-stimulating hormone (FSH) plays a crucial role in the development of the reproductive system and is extensively utilized in both diagnostic and therapeutic applications within developmental and reproductive medicine (Rose, Gaines Das, & Balen, 2000). An FSH Levels Chart effectively illustrates the normal range of FSH concentrations at various life stages and throughout the menstrual cycle.
Understanding FSH is essential, as it is a critical hormone for reproductive health, particularly for individuals assigned female at birth and those assigned male at birth. In individuals assigned female at birth, FSH is vital for the maturation of ovarian follicles, which are sac-like structures in the ovaries that house developing eggs. In contrast, for those assigned male at birth, FSH facilitates the growth and development of sperm.
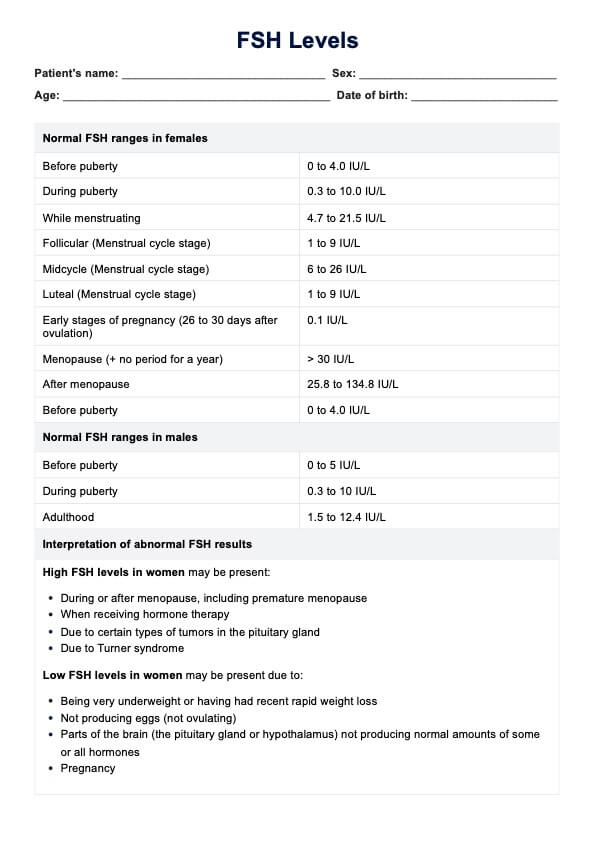
The FSH Levels Chart provides a comprehensive overview of what constitutes normal FSH levels across different contexts (University of California San Francisco Benioff Children's Hospitals, 2020). The established normal ranges are as follows:
For females:
- Before puberty, FSH levels typically fall within the range of 0–4 IU/L.
- FSH levels may vary from 0.3 to 10 IU/L during puberty.
- While menstruating, the typical FSH level range is 4.5–21.5 IU/L.
- After menopause, FSH levels tend to increase, ranging from 25.8 to 134.8 IU/L.
For males:
- Before puberty, FSH levels generally range from 0—5 IU/L.
- FSH levels may fluctuate between 0.3—10 IU/L during puberty.
- In adulthood: The usual range is 1.5—12.4 IU/L.
It is essential to note that the ranges found in charts can vary slightly between different laboratories and studies. Additionally, several factors can influence FSH levels, including an individual's weight and various underlying health conditions.


