What Is an Estradiol Levels Chart?

Estradiol is the most common form of estrogen in females and has a wide range of essential roles in growth, development of secondary sex characteristics, and maintenance of pregnancy. 

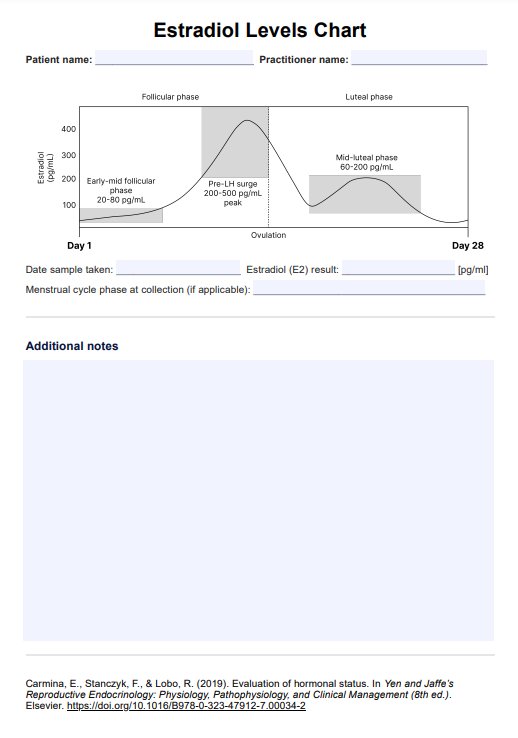
Our Estradiol Levels Chart is a graphical resource that illustrates the typical cyclic fluctuations in serum estradiol levels (in pg/mL) throughout one uterine cycle. These fluctuations will look different depending on whether an individual is pre-pubescent, pre-menopausal, pregnant, or post-menopausal. As such, there can be a wide range of normal values of estradiol levels depending on cycle timing or life stage.

An estradiol blood test result is generally given as a single concentration presented with the normal reference range of estrogen in the population. Rather than providing this data as numbers and ranges, this Estradiol Levels Chart plots the average estradiol values in the population over 28 days and the normal range for post-pubescent, pre-menopausal females. 

This handy resource condenses much information on estradiol levels into a single visual chart that can serve as a tremendous educational resource or supplementary tool alongside estradiol blood test results.

Printable Estradiol Levels Chart PDF here

Check out our free Estradiol Levels Chart PDF here

How Does it Work?

The Estradiol Levels Chart is a straightforward and efficient tool designed to assist healthcare professionals in tracking and interpreting estradiol levels in patients. Here's how to use it effectively:

  1. Download and Prepare the Chart: Easily download the PDF version of the Estradiol Levels Chart. You can fill it out digitally or print it for manual entry.
  2. Fill in Patient Details: Enter the patient's name and the date at the chart's top. This ensures clear identification and record-keeping.
  3. Enter Estradiol Results: Record the patient’s Estradiol (E2) levels in the designated space. It’s important to note the measurement units (pg/mL or pmol/L) used in the blood test results.
  4. Add Contextual Information: If relevant, indicate the phase of the menstrual cycle during which the estradiol sample was taken. This context is crucial for accurate interpretation.
  5. Interpretation and Notes: Utilize the chart to compare the patient’s E2 levels against standard ranges. Consider the patient's specific health context and add your professional interpretation and any pertinent notes in the provided space.

The Estradiol Levels Chart is invaluable for managing and understanding hormonal health. Its ease of use and clarity make it essential to patient care, allowing for precise monitoring and tailored treatment strategies.

Estradiol Levels Chart Example (Sample)

To see how this Estradiol Levels Chart can help you best inform your patients of their Estradiol test results, just look at our Estradiol Levels Chart Example. 

This example shows how a seemingly high Estradiol measurement can be put in the context of the natural fluctuations during the late follicular phase. 

Feel free to download this sample here.

Download our free Estradiol Levels Chart PDF here

Estradiol Levels Chart Example

When Would You Use This Chart?

The Estradiol Levels Chart is essential for healthcare professionals to understand estradiol hormone fluctuations. This chart is handy in various clinical scenarios, providing valuable insights for patient care.

  • Monitoring Menstrual Health: For patients experiencing irregular menstrual cycles, this chart helps assess estradiol levels across different phases of the menstrual cycle.
  • Fertility Assessments: In cases of infertility or when assessing ovulation patterns, the chart can guide understanding estradiol's role in ovulation and reproductive health.
  • Menopause Management: To evaluate symptoms related to menopause and perimenopause, this chart aids in tracking estradiol levels, which significantly fluctuate during these stages.
  • Hormone Replacement Therapy (HRT): For patients undergoing HRT, especially in transgender healthcare, the chart is crucial for monitoring hormone levels and adjusting treatment plans.
  • Evaluating Hormonal Imbalances: In diagnosing conditions like polycystic ovary syndrome (PCOS) or estrogen dominance, the chart provides a framework for understanding estradiol variations.

The Estradiol Levels Chart is a versatile and invaluable resource in a healthcare setting. It aids in making informed decisions, ensuring patient-specific care, and enhancing the understanding of hormonal health across various medical contexts.

Research & Evidence

Ranges for estradiol levels at different phases of the menstrual cycle have been widely published, and techniques for measuring serum estradiol levels have been refined and improved since the first published values in the 1950s.

While the exact values can differ significantly between individuals, the relative estradiol changes throughout the menstrual cycle, such as the mid-cycle estradiol surge, have been consistently reported in journal articles from the 1970s (Korenman et al., 1974; Sherman & Korenman, 1975), 1980s (Hoff et al., 1984), 1990s (Fritz et al., 1992), 2000s (Burger et al., 2007) right up to present day endocrinology textbooks (Strauss & Barbieri, 2018; Taylor et al., 2020).

Therefore, the pattern of estradiol levels throughout the menstrual cycle is a well-researched topic with a wealth of evidence to support its various key features. 

The values presented in this Estradiol Levels Chart resource are taken from Yen & Jaffe’s Reproductive Endocrinology (Strauss & Barbieri, 2019) but are generally consistent with historically reported values. Within this textbook, Carmina et al. (2019) give the range of Estradiol concentrations at the mid-cycle surge as 200-500 pg/mL, whereas Heitz et al. (1999) provide the peak values as 778 +/- 255.43 pg/mL, and another earlier study gives the peak values as about 320-520 pg/mL (Korenman et al., 1974).

As such, it is clear that a wide range of values at each stage of the menstrual cycle can be considered normal, and it should be remembered that the values cited in these sources indicate the sample population of each study. Individuals may have measurements higher or lower than these ranges without anything pathological necessarily causing these differences.

Therefore, this resource attempts to present a stylized diagram of estradiol fluctuations throughout the menstrual cycle, indicating the possible ranges of values at each phase shown.

References

  • Burger, H. G., Hale, G. E., Robertson, D. M., & Dennerstein, L. (2007). A review of hormonal changes during the menopausal transition: Focus on Melbourne Women’s Midlife Health Project findings. Human Reproduction Update, 13(6), 559–565. https://doi.org/10.1093/humupd/dmm020
  • Carmina, E., Stanczyk, F. Z., & Lobo, R. A. (2019). Evaluation of Hormonal Status. In Yen and Jaffe’s Reproductive Endocrinology (pp. 887-915.e4). Elsevier. https://doi.org/10.1016/B978-0-323-47912-7.00034-2
  • Heitz, N. A., Eisenman, P. A., Beck, C. L., & Walker, J. A. (1999). Hormonal Changes Throughout the Menstrual Cycle and Increased Anterior Cruciate Ligament Laxity in Females. Journal of Athletic Training, 34(22), 14–149.
  • Korenman, S. G., Stevens, R. H., Carpenter, L. A., Robb, M., Niswender, G. D., & Sherman, B. M. (1974). ESTRADIOL RADIOIMMUNOASSAY WITHOUT CHROMATOGRAPHY: PROCEDURE, VALIDATION AND NORMAL VALUES. The Journal of Clinical Endocrinology & Metabolism, 38(4), 718–720. https://doi.org/10.1210/jcem-38-4-718
  • Sherman, B. M., & Korenman, S. G. (1975). Hormonal characteristics of the human menstrual cycle throughout reproductive life. Journal of Clinical Investigation, 55(4), 699–706. https://doi.org/10.1172/JCI107979
  • Strauss, J. F., & Barbieri, R. L. (Eds.). (2019). Yen & Jaffe's Reproductive Endocrinology: Physiology, Pathophysiology, and Clinical Management. Elsevier.
  • Taylor, H. S., Pal, L., & Seli, E. (2020). Speroff's Clinical Gynecologic Endocrinology and Infertility. Wolters Kluwer.
What causes the mid-cycle spike in Estradiol?

Commonly asked questions

What causes the mid-cycle spike in Estradiol?

As the dominant follicle develops, it secretes estradiol. Estradiol levels continue to increase as the follicle grows, providing negative feedback on LH and FSH levels at low concentrations but causing a significant LH surge once estradiol levels are high enough. This LH surge then triggers ovulation.

Why does Estradiol rise again in the mid-luteal phase?

In the mid-luteal phase, estradiol levels rise again- although not to the same extent as the initial spike just before ovulation. This mid-luteal phase rise is due to the corpus luteum formation, which secretes estradiol, among other hormones. This estradiol secretion is designed to maintain the endometrial lining in preparation for pregnancy. If fertilization does not occur, estradiol and progesterone levels will eventually decline, and menstruation will be triggered.

Is this Estradiol Levels Chart representative of everyone?

No. Many individuals will have menstrual cycles that are longer, shorter, or irregular when compared to this standard 28-day cycle. Additionally, this Estradiol Levels Chart provides a stylized representation of relative changes in estradiol over an average menstrual cycle. It should not be considered the only normal pattern of estradiol fluctuations.

Join 10,000+ teams using Carepatron to be more productive

One app for all your healthcare work