What is an ANA Levels Chart?

An ANA (Antinuclear Antibody) Levels Chart is a medical resource that provides a graphical representation of the levels of antinuclear antibodies in a patient's blood. Antinuclear antibodies are proteins produced by the immune system that mistakenly target and attack the body's cells and tissues, particularly the nucleus of cells. The presence and quantity of these antibodies are often measured through blood tests, and the results are typically reported as titers.

This chart serves as a visual aid for healthcare professionals to interpret and understand the results of these tests. The chart typically displays different levels or titers of ANA, ranging from low to high, and may include specific antibody patterns associated with various autoimmune diseases. 

Autoimmune diseases are conditions in which the immune system attacks healthy cells. ANA testing is commonly used to diagnose and monitor these disorders, such as lupus, rheumatoid arthritis, and Sjögren's syndrome.
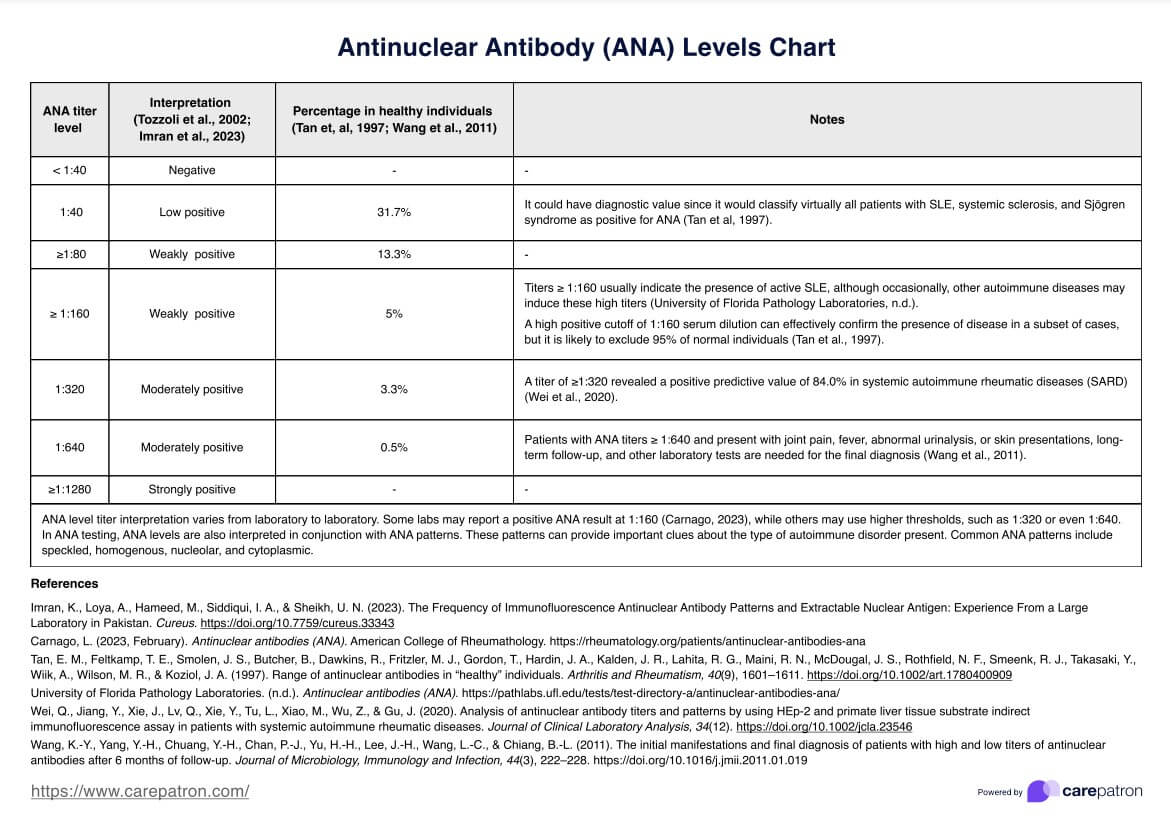
The chart assists healthcare providers in assessing the severity of the immune system's response and aids in the identification of specific autoimmune conditions based on the pattern of antibodies present. Interpreting ANA levels is crucial for determining the appropriate treatment and management strategies for patients with autoimmune diseases.

Patients and their caregivers can also benefit from the ANA Levels Chart as it visually represents the immune system's activity, fostering better understanding and communication between healthcare professionals and those affected by autoimmune conditions. 

The ANA Levels Chart is a valuable tool in diagnosing, monitoring, and managing autoimmune diseases, contributing to more informed decision-making in rheumatology and immunology.

Download our free ANA Levels Chart PDF here

Check out our ANA Levels Chart PDF here

How Does It Work?

Understanding and utilizing a Printable ANA Levels Chart involves steps from accessing the form to interpreting results. Here's a breakdown of the process:

1. Accessing the Form

Locate a printable ANA Levels Chart, often provided by healthcare institutions or available online. Ensure that the chart is up-to-date and aligns with current medical standards.

2. Patient Information

Fill in essential patient details, including name, date of birth, and relevant identification information. Provide information about the date and time of the blood draw.

3. Recording ANA Levels

Enter the ANA titers from the blood test results in the designated spaces. Titers are typically expressed as ratios (e.g., 1:80), indicating the dilution at which ANA remains detectable.

4. Visual Patterns

Some charts may include visual representations of different ANA patterns, such as speckled, homogeneous, or nucleolar. Cross-reference the obtained patterns from the test with those on the chart to identify potential autoimmune associations.

5. Reference Ranges

Ensure the chart includes reference ranges or cutoff values for normal and abnormal ANA levels. Interpret results in the context of these reference ranges to determine the significance of the antibody levels.

6. Clinical Correlation

Consider the patient's symptoms, medical history, and other diagnostic tests. Correlate the ANA levels and patterns with clinical findings to guide further investigation or diagnosis.

7. Healthcare Professional Consultation

Share the completed chart with a healthcare professional for a comprehensive evaluation. Collaborate with the healthcare team to understand the implications of the results and discuss potential treatment options.

8. Follow-Up

If necessary, schedule follow-up appointments and additional ANA tests to monitor changes over time. Adjust treatment plans based on evolving clinical assessments.

Ana Levels Chart Example (Sample)

In this case, the patient, a 45-year-old female experiencing joint pain and fatigue, underwent an ANA test revealing an elevated titer of 1:320 with a speckled pattern indicative of potential autoimmune activity. The patient has no known autoimmune history but a family history of rheumatoid arthritis, prompting further investigation. 

The ANA Levels Chart records the patient's information, test results, clinical evaluation, and proposed treatment plan. Further tests for specific autoantibodies, consultation with a rheumatologist, and NSAIDs for symptom relief may be recommended.

The chart guides the follow-up plan, including repeat ANA testing and monitoring appointments, enhancing communication between healthcare professionals, and ensuring a patient-centered approach to autoimmune disease management. 

This sample ANA Levels Chart is a valuable reference in navigating the diagnostic process and tailoring treatment strategies to the patient's needs.

Download our Ana Levels Chart PDF

Download our Ana Levels Chart PDF

When Would You Use This Chart?

The ANA Levels Chart is a valuable resource primarily utilized by healthcare practitioners, especially in rheumatology, immunology, and internal medicine. Here are scenarios when this chart proves to be particularly beneficial:

  • Autoimmune Disease Diagnosis: The chart is extensively used when investigating and diagnosing autoimmune diseases. Elevated levels of antinuclear antibodies and specific patterns observed on the chart can provide crucial insights into conditions such as lupus, rheumatoid arthritis, and scleroderma.
  • Monitoring Disease Progression: Practitioners regularly employ the ANA Levels Chart to monitor the progression of autoimmune diseases over time. Periodic testing allows healthcare professionals to assess changes in antibody levels and patterns, helping to refine treatment strategies and adjust medications accordingly.
  • Treatment Efficacy Assessment: The chart becomes useful when managing autoimmune disorders with immunosuppressive therapies. It helps evaluate the effectiveness of treatments by tracking fluctuations in ANA levels and guiding clinicians in making informed decisions regarding medication adjustments.
  • Differentiating Autoimmune Conditions: The chart assists in distinguishing between various autoimmune conditions. Different patterns on the chart may be associated with specific diseases, aiding practitioners in narrowing down potential diagnoses and formulating targeted treatment plans.
  • Educational Purposes: The chart is valuable for educating healthcare professionals and patients. It serves as a visual aid that enhances understanding of autoimmune diseases, ANA testing, and the significance of specific antibody patterns.
  • Research and Clinical Studies: Researchers in immunology and rheumatology may use aggregated ANA Levels Charts in clinical studies. This can contribute to a broader understanding of the prevalence and patterns of antinuclear antibodies in specific populations.
  • Preventive Medicine: In some cases, practitioners may use ANA testing and the chart as part of preventive medicine. This is particularly relevant when assessing individuals with a family history of autoimmune diseases or those exhibiting early symptoms.

What Do the Results Mean?

Interpreting the results of an ANA test, often accompanied by a free ANA Levels Chart, requires a nuanced understanding of the various patterns and titers. Here's an overview of expected results and their potential implications:

  • Negative Results: A negative result generally means that no antinuclear antibodies were detected in the blood during the test. This is considered normal and suggests the absence of autoimmune activity.
  • Low Titers (1:40 to 1:80): Low titers may be within the normal range, and many healthy individuals may have low-level ANA without any autoimmune disease. Considering the overall clinical picture and symptoms in such cases is crucial.
  • Moderate Titers (1:160 to 1:320): Moderate titers may indicate a potential autoimmune response. Healthcare professionals will assess the patient's symptoms, medical history, and other diagnostic factors to determine if further investigation or monitoring is necessary.
  • High Titers (1:640 and above): High titers are more suggestive of autoimmune activity and may warrant closer attention. However, a high titer alone does not diagnose a specific autoimmune disease. Clinical correlation and additional tests are essential for a comprehensive evaluation.
  • Distinct Patterns on the Chart: The ANA Levels Chart often includes visual representations of antibody patterns, such as speckled, homogeneous, nucleolar, or centromere patterns. These patterns can provide clues about potential autoimmune conditions.
  • Homogeneous Pattern: Often associated with systemic lupus erythematosus (SLE) but can be found in other autoimmune conditions.
  • Speckled Pattern: Commonly seen in lupus and Sjögren's syndrome but may also be present in other autoimmune disorders.
  • Nucleolar Pattern: Associated with scleroderma and other connective tissue diseases.
  • Centromere Pattern: Found in conditions like systemic sclerosis (scleroderma) and limited cutaneous systemic sclerosis.

Why Use Carepatron as Your ANA Levels App?

Are you looking for unparalleled efficiency and precision in managing ANA levels? Look no further than Carepatron's cutting-edge ANA Levels Chart app. 

Our app is tailored specifically to meet the needs of healthcare professionals like you, and we're confident that it's the go-to solution for seamlessly handling and interpreting ANA test results.

Our software streamlines results in interpretation with a digital ANA Levels Chart and intuitive features. Record patient info, visualize antibody patterns, and navigate the user-friendly interface for quick and accurate diagnoses.

But that's not all. Our ANA Levels Chart app facilitates seamless interaction between healthcare professionals and patients through secure communication. This collaborative approach enhances patient engagement and contributes to a patient-centered healthcare experience.

So why choose Carepatron? Our transformative ANA Levels Chart app elevates precision, efficiency, and collaboration in autoimmune disease management, and we're enthusiastic about the positive impact it can have on your practice. Join us today and experience the benefits for yourself!

Clinical documentation software benefit

References

Al-Zougbi, A., MD. (n.d.). Antinuclear Antibody: reference range, interpretation, collection, and panels. https://emedicine.medscape.com/article/2086616-overview?form=fpf 

Bio-Rad Diagnostics. (2018, June 15). 4. What to do with a positive ANA IFA Screen [Video]. YouTube. https://www.youtube.com/watch?v=0T6LAd-2M5s 

Cınar, O. K., Foley, C., Al‐Hussaini, A., Gilmour, K., Buckland, M., & Obaidi, M. A. (2019). 34 Can high ANA titer and clinical features predict developing autoimmune conditions in children? BMJ Journals. https://doi.org/10.1136/archdischild-2019-gosh.34 

Irure‐Ventura, J., & López-Hoyos, M. (2022). The past, present, and future in Antinuclear Antibodies (ANA). Diagnostics, 12(3), 647. https://doi.org/10.3390/diagnostics12030647 

Jones, C. (2019, January 17). ANA and rheumatologic tests. Cancer Therapy Advisor. https://www.cancertherapyadvisor.com/home/decision-support-in-medicine/hospital-medicine/ana-and-rheumatologic-tests/ 

Nosal, R. S. (2022, December 29). Biochemistry, Antinuclear Antibodies (ANA). StatPearls - NCBI Bookshelf. https://www.ncbi.nlm.nih.gov/books/NBK537071/

Who typically requests an ANA Levels Chart?

Commonly asked questions

Who typically requests an ANA Levels Chart?

ANA Levels Charts are typically requested by healthcare professionals, especially rheumatologists, immunologists, and internal medicine practitioners. These charts aid in diagnosing and managing autoimmune diseases.

When are ANA Levels Charts used?

ANA Levels Charts are used when assessing patients for autoimmune diseases. They play a crucial role in diagnosing, monitoring, and managing conditions such as lupus, rheumatoid arthritis, and scleroderma.

How are ANA Levels Charts used?

Healthcare professionals use ANA Levels Charts to interpret the results of ANA tests. The charts provide a visual representation of antibody levels and patterns, aiding in identifying specific autoimmune conditions and guiding treatment decisions.

How long does an ANA Levels Chart take?

The time to complete an ANA Levels Chart depends on the specific software or format used. Typically, filling in patient information and recording ANA levels can be done efficiently, and the chart is designed for quick reference during the diagnostic process. The duration may vary based on the complexity of the patient's case and the healthcare professional's workflow.

Join 10,000+ teams using Carepatron to be more productive

One app for all your healthcare work