What Is an A1C Glucose Chart?

An A1C glucose chart, or hemoglobin A1C chart, is a valuable tool for managing diabetes. This chart provides a visual representation of how blood glucose levels have been controlled over a specific period, typically spanning two to three months. "A1C" refers to hemoglobin A1C, a molecule in red blood cells that binds to glucose. The A1C test measures the percentage of hemoglobin with glucose attached to it, reflecting the average blood sugar levels over an extended period.

The A1C glucose chart is designed to track and monitor the long-term glycemic control of individuals with diabetes. It provides a numerical value typically expressed as a percentage, where lower percentages indicate better blood sugar control. For people without diabetes, a typical A1C level is around 5% to 5.6%. In contrast, for those with diabetes, the target range may vary but is usually set by healthcare professionals, aiming to keep it below a certain threshold (often around 7% or lower).

This chart is a crucial resource for both healthcare providers and individuals with diabetes, as it helps in assessing the effectiveness of treatment plans and making necessary adjustments. By regularly checking and analyzing A1C levels, healthcare professionals can tailor their recommendations and medications to ensure blood sugar remains within target ranges.

For individuals with diabetes, the A1C glucose chart serves as a means to monitor their progress and make informed decisions regarding diet, exercise, and medication. It empowers them to take charge of their health and make necessary lifestyle changes to achieve better blood sugar management.

Printable A1c Glucose Chart

Check out our free A1c Glucose Chart PDF

How Does It Work?

Step 1: Obtain a Printable A1C Glucose Chart

Search for a printable A1C glucose chart online or ask your healthcare provider for a copy. These charts are free on various medical websites and diabetes management resources or can be provided by your healthcare team.

Step 2: Gather Your A1C Test Results

To use the chart effectively, you'll need your A1C test results. Your healthcare provider or lab typically provides this information. Ensure that you have the most recent A1C value available.

Step 3: Enter the A1C Value

Locate the A1C value on your test result report. It is usually expressed as a percentage. On the printable chart, find the corresponding space or cell for the A1C value.

Step 4: Choose the Time Frame

A1C reflects an average blood sugar level over a specific time, typically two to three months. Some charts may allow you to specify the time frame (e.g., 2 or 3 months) or may provide a standard time frame.

Step 5: Plot the A1C Value

Use a pen or marker to mark or highlight the A1C value on the chart based on the time frame you've chosen. This is usually done on a horizontal axis representing time.

Step 6: Interpret the Results

Once you've plotted your A1C value, you can interpret the results. Most charts will have a color-coded or numerical guide indicating whether your A1C level falls within a target range, typically below 7% for individuals with diabetes.

Step 7: Discuss with Your Healthcare Provider

If your A1C level falls outside the target range, consult with your healthcare provider to discuss potential adjustments to your diabetes management plan, which may include changes in diet, medication, or exercise.

A1C Glucose Chart Example (Sample)

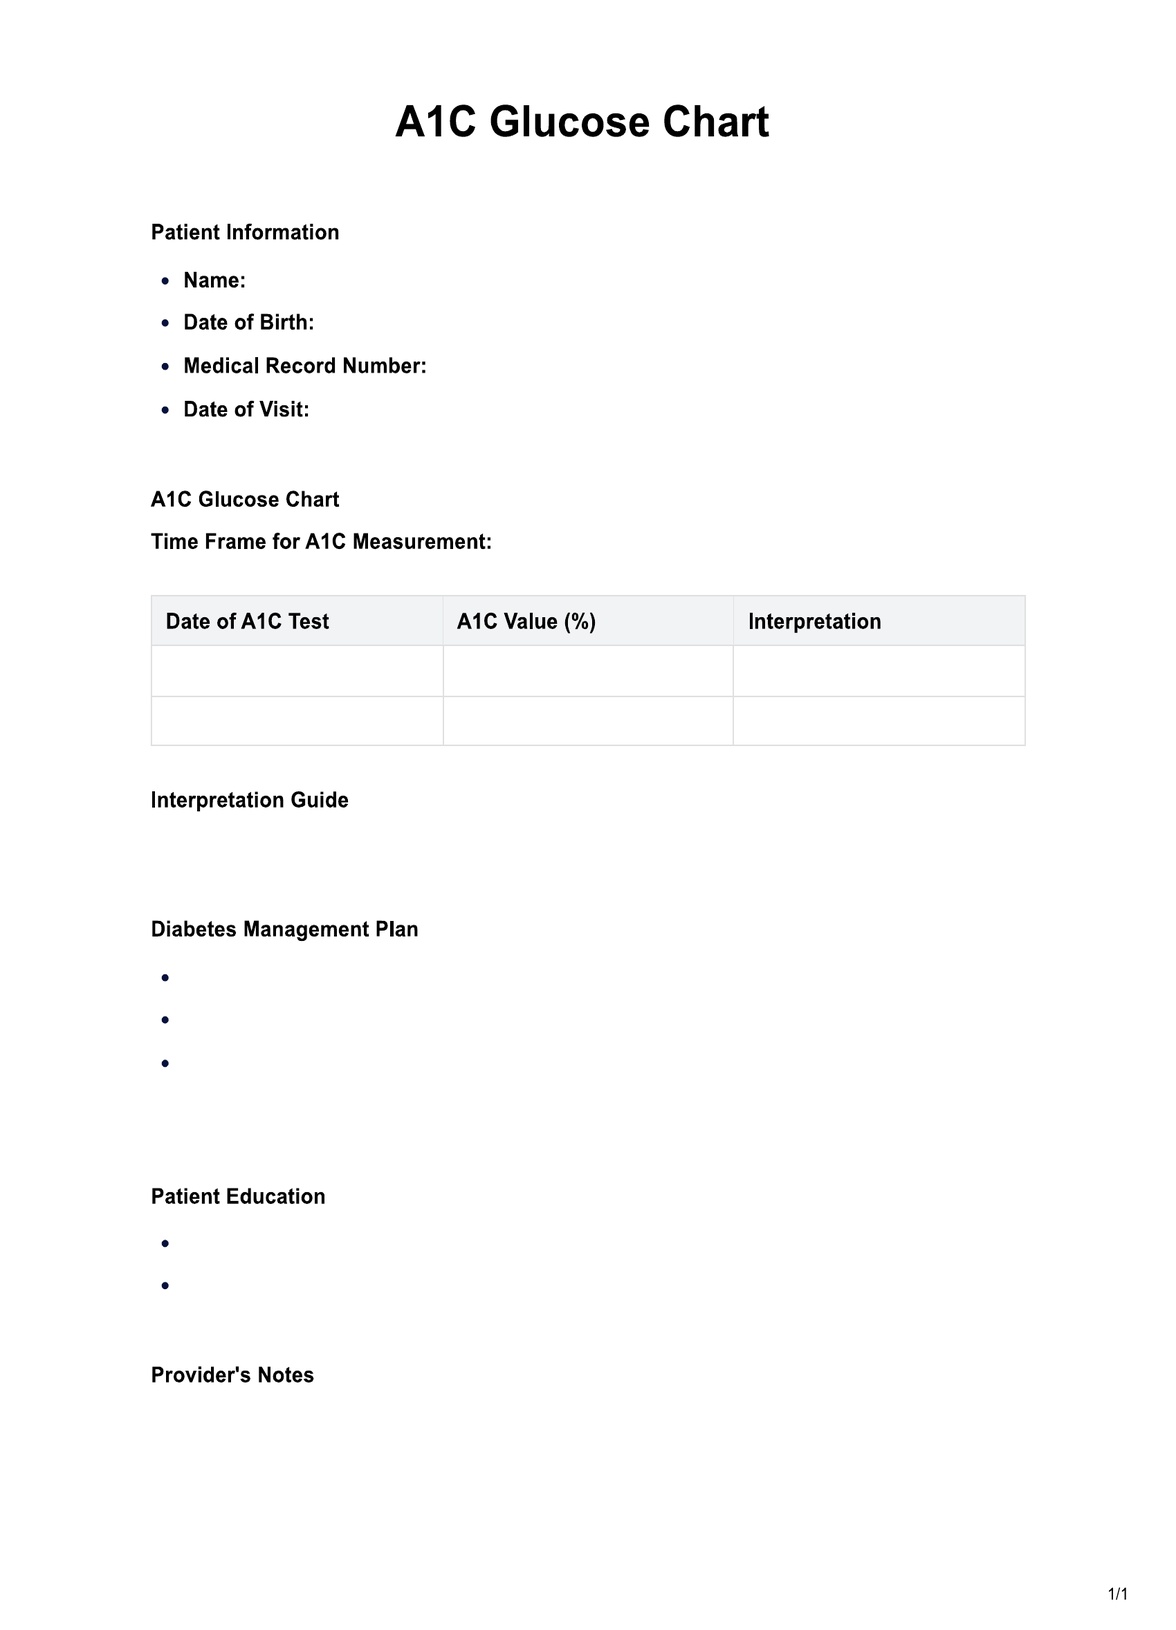
The A1C Glucose Chart example, as depicted in the sample provided, is a vital tool for healthcare professionals to monitor and manage diabetes in their patients. 

This comprehensive template offers a structured format for recording crucial patient information, including A1C test results, interpretation guidelines, and a tailored diabetes management plan. It provides an organized way to track A1C values over time, facilitating a holistic approach to diabetes care. 

This A1C Glucose Chart is available in PDF format, making it easily accessible and a convenient resource for healthcare practitioners to use during patient visits, ensuring that diabetes management remains efficient and well-documented. 

It aids in setting glycemic targets, evaluating treatment strategies, and delivering patient education, all aimed at improving blood sugar control and reducing the risk of diabetes-related complications.

Download this A1C Glucose Chart Here:

When Would You Use This Chart?

The A1C Glucose Chart is a valuable resource used by various healthcare practitioners and individuals with diabetes to monitor and manage blood sugar levels. Here are key instances when this chart is appropriately used:

  • Diagnosis and Initial Assessment: Healthcare providers use A1C charts to assess newly diagnosed diabetes patients and determine the severity of the condition.
  • Treatment Planning: These charts assist in formulating personalized diabetes management plans, setting glycemic targets, and selecting appropriate medications or interventions.
  • Monitoring Long-Term Control: Periodic A1C tests, in conjunction with the chart, are used to monitor a patient's long-term blood sugar control, enabling healthcare providers to track progress over time.
  • Routine Check-ups: Primary care physicians use A1C charts during regular check-ups to screen for diabetes or evaluate the effectiveness of diabetes management for their patients.
  • Specialized Care: Endocrinologists specializing in endocrine disorders like diabetes rely on A1C charts to closely monitor and manage the condition, making necessary adjustments to treatment plans.
  • Patient Education: Diabetes educators use the A1C chart to educate patients on the significance of A1C values and help them set achievable glycemic goals.
  • Self-Monitoring: Individuals with diabetes can use these charts to self-monitor their A1C values and track their progress, enabling them to make informed decisions about diet, exercise, and medication adjustments.
  • Goal Setting: Patients can set personal glycemic targets and use the chart to see if they are meeting those goals.
  • Communication with Healthcare Providers: Patients can bring their A1C charts to healthcare appointments to facilitate discussions with their healthcare team regarding their diabetes management.
  • Epidemiological Studies: A1C data collected from populations is used to conduct research and analyze trends in diabetes control and management.
  • �?�Public Health Planning: Public health officials can use aggregated A1C data to plan and implement strategies for diabetes prevention and control at a community or national level.

What do the Results Mean?

Interpreting the results from an A1C Glucose Chart is essential for understanding an individual's diabetes control over the past two to three months. The A1C value is typically expressed as a percentage and can provide valuable insights into a person's blood sugar management. Here's what common A1C results usually mean:

Normal (Non-Diabetic) A1C

A1C levels in the range of 4% to 5.6% are considered normal for individuals without diabetes. This suggests excellent blood sugar control with minimal risk of diabetes-related complications.

Prediabetes

A1C values between 5.7% and 6.4% indicate prediabetes, a condition where blood sugar levels are higher than normal but not yet in the diabetic range. It signifies an increased risk of developing type 2 diabetes, prompting the need for lifestyle changes to prevent or delay the onset of diabetes.

Diabetes Control

A1C values of 6.5% or higher often indicate diabetes. The specific A1C value can give insights into the level of diabetes control:

  • Poor Control: A1C above 8% suggests inadequate blood sugar management, increasing the risk of complications.
  • Fair Control: A1C between 7% and 8% implies reasonable but not optimal blood sugar control.
  • Good Control: A1C between 6% and 7% reflects good blood sugar management, lowering the risk of complications.
  • Excellent Control: A1C below 6% indicates excellent diabetes control, with minimal risk of complications.

Treatment Evaluation

For individuals with diabetes, the A1C chart can track changes in A1C values over time. A reduction in A1C over multiple tests suggests that treatment strategies, such as medication, diet, and exercise, effectively improve blood sugar control.

Target A1C levels may vary based on individual circumstances. Consult a healthcare professional to interpret results and make informed decisions about diabetes management. Regular monitoring of A1C levels is vital to maintain optimal blood sugar control and reduce the risk of diabetes-related complications.

Practice management software positive feedback

Why Use Carepatron as Your A1C Glucose App?

Carepatron is the ultimate choice for managing your A1C Glucose Chart, offering the most advanced A1C Glucose Chart app and software on the market. 

Our A1C Glucose Chart app and software are designed with user convenience in mind. With a clean and intuitive interface, tracking and managing your A1C levels has never been easier. Our platform allows you to effortlessly enter your A1C values, view historical data and set personalized glycemic goals with just a few clicks.

Our platform continues beyond A1C charting. We offer a comprehensive suite of tools and features that empower individuals with diabetes to take control of their health. From meal tracking and medication schedules to personalized recommendations and real-time data analysis, we provide everything you need to manage your diabetes proactively.

We prioritize the security of your health data. With Carepatron, your A1C Glucose Chart information is stored securely, ensuring your privacy is safeguarded. Plus, our cloud-based software allows you to access your data from anywhere, at any time, whether on your mobile device or desktop computer, making it the most accessible and reliable platform for managing your A1C levels.

Choose Carepatron for your A1C Glucose Chart needs and experience the ease and effectiveness of modern diabetes management. Take control of your health, set and achieve your glycemic targets, and access a comprehensive suite of diabetes management tools all in one place. Join the Carepatron community today for a brighter, healthier future.

Clinical documentation software

References

Brewster, C. (2023, August 30). Blood sugar level chart: Readings in older adults. Verywell Health. https://www.verywellhealth.com/elderly-blood-sugar-levels-chart-5176546 

Davis, C. P., MD PhD. (2022, April 1). Hemoglobin A1C Test: Normal, Low/High Levels, Chart & Schedule. MedicineNet. https://www.medicinenet.com/hemoglobin_a1c_test/article.htm 

Dierks, M. H. (2020, April 30). A1C: What it Measures, Conversion Calculator, Ranges & Tips. AgaMatrix. https://agamatrix.com/blog/a1c-calculator/ 

Eyth, E. (2023, March 13). Hemoglobin A1C. StatPearls - NCBI Bookshelf. https://www.ncbi.nlm.nih.gov/books/NBK549816/ 

Horowitz, G. L., MD. (n.d.). Hemoglobin A1C testing: reference interval, interpretation, background. https://emedicine.medscape.com/article/2049478-overview?form=fpf 

Modglin, L. (2023, September 21). Normal Blood Sugar Levels By Age (Chart). Forbes Health. https://www.forbes.com/health/body/normal-blood-sugar-levels/ 

MyEndoConsult. (2023, March 16). A1C To Glucose Conversion Calculator - MyEndoConsult. My Endo Consult. https://myendoconsult.com/learn/a1c-calculator/#google_vignette 

Srakocic, S. (2023, February 24). Blood sugar level charts for Type 1 and Type 2 diabetes. Healthline. https://www.healthline.com/health/diabetes/blood-sugar-level-chart

Who typically requests an A1C Glucose Chart?

Commonly asked questions

Who typically requests an A1C Glucose Chart?

A1C Glucose Charts are typically requested by healthcare providers, including doctors, endocrinologists, and diabetes educators, for individuals with diabetes.
�?�

When are A1C Glucose Charts used?

A1C Glucose Charts assess and monitor blood sugar control over two to three months. They are employed during diagnosis, treatment planning, and routine check-ups for diabetes management.

�?�

How are A1C Glucose Charts used?

A1C Glucose Charts involve plotting the A1C value, typically expressed as a percentage, on a chart to assess blood sugar control. The chart aids in setting glycemic goals, evaluating treatment effectiveness, and guiding diabetes management decisions.

�?�

How long does an A1C Glucose Chart take?

Completing an A1C Glucose Chart is quick and straightforward. It typically takes a few minutes to enter the A1C value and interpret the results. The actual test to obtain the A1C value is a blood test that may take a few minutes in a clinical setting.

�?�

Join 10,000+ teams using Carepatron to be more productive

One app for all your healthcare work