
What is a Red Blood Cell Count Chart?
Our Red Blood Cell Count Chart is a streamlined tool designed for healthcare professionals to record and monitor a patient’s RBC levels efficiently. It provides an organized format to document patient information, reference ranges, and test results, ensuring accurate tracking and interpretation of red blood cell counts over time.
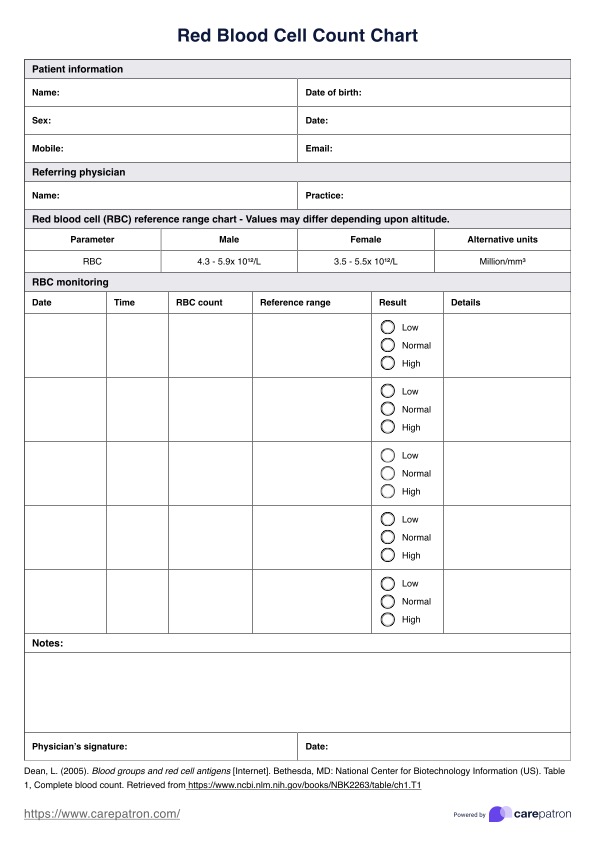
The chart includes sex-specific reference ranges for RBC levels, making it easy for clinicians to compare individual results against established norms. With dedicated sections for recording test dates, times, and results, the chart supports longitudinal monitoring, allowing healthcare providers to identify trends and evaluate treatment outcomes effectively.
Designed with ease of use in mind, the chart incorporates space for physician notes and signatures to validate results and provide recommendations. It's clear, concise structure makes it a practical tool for both routine and diagnostic use, supporting high-quality, patient-centered care.


