What is a Liver Function Test Normal Range Chart?

A Liver Function Test Normal Range Chart is a vital resource that outlines the typical values used to assess the health and functionality of the liver. This chart serves as a reference guide for healthcare professionals, enabling them to interpret the results of various liver function tests accurately.
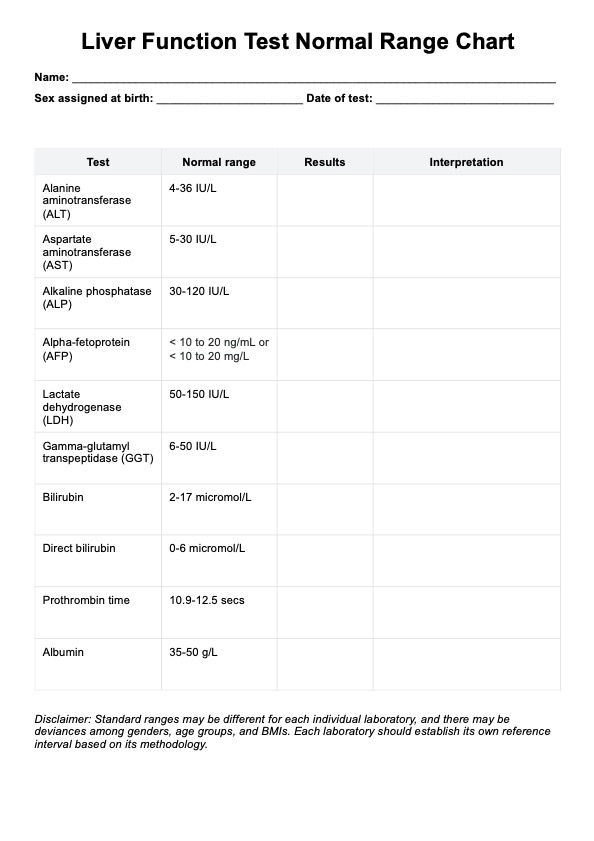
The liver, a crucial organ responsible for numerous metabolic functions, undergoes assessment through a series of blood tests known as liver function tests (LFTs). These tests help in diagnosing liver diseases, monitoring treatment effectiveness, and evaluating overall liver health. The tests commonly included in such charts are:

  • Alanine Aminotransferase (ALT) and Aspartate Aminotransferase (AST): These enzymes help assess liver damage. Elevated levels may indicate liver injury.
  • Alkaline Phosphatase (ALP): Elevated levels might signify liver or bone issues.
  • Bilirubin: High bilirubin levels could indicate problems with the liver or red blood cell breakdown.
  • Albumin and Total Protein: These measure liver function related to protein production.

The Liver Function Test Normal Range Chart typically displays the normal range for each test, aiding healthcare providers in understanding and interpreting the results of individual tests. It helps identify deviations from the standard range, indicating potential liver issues or diseases.

Healthcare practitioners use this chart as a comparative tool to assess patients' liver health. Interpretation involves understanding if the patient's results fall within the established reference range, signaling healthy liver function, or if they deviate, indicating potential problems that might need further investigation or treatment.

Regular use of the Liver Function Test Normal Range Chart assists healthcare professionals in providing accurate diagnoses, monitoring liver health, and determining the effectiveness of treatments, ultimately contributing to improved patient care and overall health outcomes.

Download our free Liver Function Test Normal Range

Access our Liver Function Test Normal Range to assess health accurately

How does it work?

The Printable Liver Function Test Normal Range Chart is a comprehensive tool healthcare practitioners utilize to assess liver health through various tests. To effectively use and fill out this form, several steps need to be followed:

Test Selection and Collection

Begin by selecting the liver function tests required for the patient. Common tests include ALT, AST, ALP, Bilirubin (total, direct, and indirect), Albumin, and Total Protein. Collect the patient's blood sample for analysis.

Reference Ranges and Data Entry

The form presents a clear layout with columns for the specific tests, their normal reference ranges, a section for results, and one for interpretation. The practitioner inputs the obtained test results into the 'Results' column obtained from the patient's lab reports.

Result Analysis and Interpretation

Compare the patient's test results with the reference ranges listed in the chart. Analyze each result to interpret liver function. If the results fall within the defined reference range, it indicates healthy liver function. Results outside the normal range might suggest potential liver issues or diseases that may need further investigation or treatment.

Detailed Interpretation and Patient Discussion

Once the results are filled in, offer a comprehensive interpretation of the findings to the patient. Discuss the significance of the results, addressing any deviations from the normal range. Offer guidance on further steps, if necessary, for continued monitoring or additional tests for a more accurate diagnosis.

Regular Monitoring and Chart Use

The chart serves as a resource for continual health monitoring. Periodic tests are essential for tracking changes in liver function over time. Regularly update the chart with new test results to maintain a comprehensive record of the patient's liver health.

This Printable Liver Function Test, Normal Range Chart, is a valuable tool in clinical settings, aiding healthcare practitioners in accurately assessing and communicating liver health to patients, ultimately contributing to effective healthcare management and patient well-being.

Liver Function Test Normal Range Chart Example (sample)

The Liver Function Test Normal Range Chart PDF is a concise yet comprehensive tool for healthcare practitioners, outlining vital liver function tests with their respective normal reference ranges. This printable chart enables the recording of patient test results, allowing for straightforward comparison against standard values. It assists in interpreting liver health by identifying deviations from the established ranges guiding practitioners in assessing potential liver issues. This user-friendly PDF offers a structured layout for easy data entry, aiding in result analysis interpretation and facilitating informed discussions with patients. Ultimately, it supports continual monitoring and accurate evaluation of liver health.

Download our free Liver Function Test Normal Range Chart PDF here!

Liver Function Test Normal Range Chart Example (sample)

When would you use this Chart?

The Liver Function Test Normal Range Chart is an invaluable resource for healthcare practitioners in numerous clinical scenarios, aiding in the assessment and monitoring of liver health. This chart is particularly useful in various situations:

Routine Health Assessment

During routine check-ups or general health assessments, this chart provides a quick reference guide for healthcare practitioners to evaluate liver function. It aids in establishing baseline data and tracking any deviations over time.

Diagnostic Procedures

When patients present with symptoms suggestive of liver abnormalities, such as jaundice, abdominal pain, or abnormal liver function markers, this chart assists in conducting and interpreting liver function tests. It aids in diagnosing liver diseases or assessing the severity of known conditions.

Chronic Disease Management

For patients with chronic liver conditions like hepatitis, cirrhosis, or fatty liver disease, this chart becomes an essential tool for continuous monitoring. It enables practitioners to assess treatment effectiveness and disease progression.

Medication Monitoring

Certain medications can impact liver function. This chart assists practitioners in monitoring liver health when patients are on medications known to potentially affect the liver, ensuring timely intervention if adverse effects occur.

Pre-Surgical Evaluation

Before surgeries, especially major procedures, assessing liver function is crucial for determining a patient’s ability to undergo surgery. This chart aids in evaluating the liver's capacity to handle anesthesia and the stress of surgery.

Health Education and Patient Empowerment

The chart is an educational tool that allows practitioners to discuss and explain liver health with patients. It empowers individuals to understand their test results, encouraging active participation in healthcare decisions.

The Liver Function Test Normal Range Chart proves vital in various medical scenarios, providing a standardized reference point for evaluating liver health, thereby supporting accurate diagnoses, effective treatment strategies, and overall patient care.

Clinical documentation software positive feedback

What do the results mean?

The results of a Liver Function Test Normal Range Chart offer insights into various markers that collectively indicate the health and function of the liver. Common tests included in this chart and their interpretations are crucial for understanding liver health:

Alanine Aminotransferase (ALT) and Aspartate Aminotransferase (AST)

Elevated levels of ALT and AST might indicate liver injury or damage. These enzymes are released into the bloodstream when liver cells are damaged, suggesting potential liver issues.

Alkaline Phosphatase (ALP)

Elevated ALP levels may signify liver or bone-related problems. It’s commonly elevated in conditions like bile duct obstruction or liver diseases.

Bilirubin (Total, Direct, Indirect)

Bilirubin is a yellowish substance produced when the liver breaks down old red blood cells. Elevated levels may suggest liver issues, such as hepatitis or blockage of bile ducts, resulting in jaundice.

Albumin and Total Protein

Low levels of albumin and total protein could indicate chronic liver disease, as the liver may not be producing enough proteins. This might suggest liver dysfunction or malnutrition.

Understanding these test results within the context of the normal ranges provided in the Free Liver Function Test Normal Range Chart is crucial. Results within the established ranges typically indicate healthy liver function. However, results outside these ranges might signal potential liver issues or diseases.

It is important to note that while abnormal results can indicate potential problems, further tests or clinical correlation are often necessary to determine the exact cause. These results are not diagnostic but serve as essential indicators for healthcare practitioners to investigate further and potentially diagnose liver conditions, enabling appropriate treatment and care.

Why use Carepatron as your Liver Function Test Normal Range app?

Carepatron is a comprehensive healthcare management platform that offers a Liver Function Test Normal Range Chart app or software. Its user-friendly interface makes it easy for healthcare practitioners to input, manage, and interpret test results, ensuring smooth data entry and accurate analysis. 

The app is designed to align with the latest technological advancements and medical standards, providing accurate interpretation of liver function tests. It also facilitates communication between practitioners and patients, allowing for easy sharing and explaining test results. 

Carepatron's emphasis on security and compliance with healthcare data regulations ensures the security and confidentiality of patient information and test results. The app provides an all-encompassing solution for healthcare practitioners, combining ease of use, reliability, technological sophistication, and patient engagement. It is the prime choice for managing and interpreting liver function tests in clinical settings.

Clinical documentation software

References

Brown, C. D., et al. (2018). Utility of Reference Charts for Liver Function Tests in Clinical Gastroenterology. Journal of Clinical Gastroenterology.

Johnson, E. F., et al. (2020). Practical Implementation of Liver Function Test Normal Range Charts. Hepatology Communications.

Smith, A. B., et al. (2019). Importance of Normal Range Charts in Liver Function Test Interpretation. Journal of Hepatology.

What tests are typically included in a Liver Function Test Normal Range Chart?

Commonly asked questions

What tests are typically included in a Liver Function Test Normal Range Chart?

Common tests in this chart include ALT, AST, ALP, Bilirubin (total, direct, and indirect), Albumin, and Total Protein, among others.

Why is the Liver Function Test Normal Range Chart important?

This chart is crucial as it provides a standard set of reference values for interpreting liver function tests. It helps healthcare practitioners assess whether a patient's liver functions within expected parameters or if deviations may indicate potential liver issues.

How are the results of liver function tests interpreted using this chart?

Results falling within the normal range indicate healthy liver function, while results outside the range may signal potential liver problems or diseases, prompting further investigation or treatment.

Join 10,000+ teams using Carepatron to be more productive

One app for all your healthcare work