Everyone has a story to tell, and here we share and celebrate those who chose care as their life's work.
These are their words, their work and we're grateful to share them.
Elizabeth and Dennis handed their billing to Carepatron and grew My Therapeutic Concepts from five clients to seventy in two months, without losing their evenings.
Looking for a tool that can help you refresh your memory on troponin levels? Read our guide to learn more about or review about troponin, the dangers of troponin level spikes. Then, use our Heart Attack Troponin Levels Chart whenever you are assessing patients for their troponin levels, or when monitoring patients for potential heart attacks.
Troponin is a complex of three regulatory proteins—troponin C, troponin I, and troponin T—that play a crucial role in muscle contraction, specifically in cardiac and skeletal muscles. It is not present in smooth muscle. The troponin complex, along with tropomyosin, regulates the interaction between actin and myosin, which are essential for muscle contraction
Typically, troponin exists within one's heart muscle cells, yet injury and damage to these cells cause the proteins to enter the bloodstream. Minimal amounts of troponin circulate within the bloodstream naturally; hence, its presence in significant levels leads to concern in medical professionals for the well-being of their patients and can signify a heart attack.
The presence of troponin T and troponin I in the blood indicates a heart injury such as a myocardial infarction, which is a blood clot in the heart. Diagnosis can be made with clinical assessment and the use of echocardiogram interpretations. Troponin levels are detectable 3-4 hours after the cardiac event, dramatically increasing over 12 hours and peaking at around 24 hours post-event.
The levels remain high for several days but are expected to lower later. Troponin I can remain high for 4-7 days after heart damage; troponin T levels can stay for as long as 3 weeks.
## **What is a troponin level test?**
A troponin levels test is a precious tool that has seen much development in recent years. Introducing high-sensitivity troponin tests means precise measurements can be made at low concentrations, leading to early detection and diagnosis. This updated, more precise troponin test typically measures the HS troponin T biomarker (MedicineNet, 2022); hence, we have included parameters related to high-sensitivity tests in this guide and the template.
The troponin tests are prevalent in cardiac injury cases because they are proven biomarkers of heart muscle cell damage. Cell breakdown and troponin release occur when blood flow to the heart muscle through the coronary vessels is blocked. This lack of oxygen causes necrosis and the cell's death (Stark & Sharma, 2023). Troponin I only exists within the heart muscle. Troponin T holds a unique structure inside the heart muscle, making it identifiable and unique compared to the minimal amount of Troponin T that exists elsewhere in the body. When the cells are damaged, these unique proteins become present in the circulating blood.
Interestingly, there is work on the event of cardiac injury, but little to no presence of troponin increase. These results highlight the importance of taking blood 2 to 3 hours after a suspected event to allow the troponin to be detectable within the bloodstream. Research has also been done on the interference of vitamin B7 or biotin (Cleveland Clinic, 2022). This vitamin can affect the result, and it is paramount that medical history, medication usage, and dosage are checked.
## **What is a Heart Attack Troponin Levels Chart?**
A Heart Attack Troponin Levels Chart is a medical resource that assists healthcare practitioners in delineating the normal, abnormal, and significantly elevated troponin levels in the bloodstream. A resource such as this exists to collate the presence of three specific cardiac structural proteins (troponin C, troponin I, and troponin T).
Troponin level charting is a well-utilized tool that helps with the crucial diagnosis of MI. Yet, it also has the potential to assist in diagnosing other medical conditions, both cardiac and non-cardiac related. See the suite of options for this particular chart use below:
### **Troponin as a marker of myocardial infarction**
Using the troponin levels test alongside a risk assessment and echocardiogram (ECG) helps formulate the diagnosis of a Myocardial infarction. The results of a troponin test cannot form a diagnosis on their own; instead, they are an aspect of diagnosis.
### **Troponin as a marker of cardiac causes**
An elevated troponin level result can indicate the need for further testing for cardiac causes such as congestive heart failure, coronary artery disease, myocarditis, and aortic valve disease. Using the troponin levels chart to assist in the recording and planning for further testing, quick and easy reflection on these results allows for the future management and treatment of serious cardiac causes.
### **Troponin as a marker of non-cardiac causes**
Conditions such as chronic kidney disease and sepsis can also cause troponin levels to rise, making this chart a viable step in the treatment and diagnosis of such conditions. Over-exercising and extreme emotional turmoil, such as severe grief and stress, can also be indicated through raised troponin levels.
While troponin charts provide a critical diagnostic baseline, they are limited by a lack of specificity; high-sensitivity assays often detect elevated levels in non-cardiac conditions like chronic kidney disease, sepsis, or even extreme physical exertion (Leite et al., 2022). Furthermore, these charts cannot distinguish between acute events and chronic injury based on a single reading, making it essential for clinicians to rely on serial testing and the patient's clinical context to confirm a heart attack.
## **How to use the template**
Our template includes a normal troponin levels chart and fields for documenting patients' troponin levels. Here's how to incorporate our template into practice:
### **Step 1: Access the template**
Click "Use Template" to open the template in the Carepatron app. From there, you can customize it, print it, or share it with other professionals. Alternatively, you can open the printable PDF by clicking "Download," but this version is not customizable. Familiarize yourself with its contents.
### **Step 2: Do the cardiac troponin test**
Draw a blood sample from the patient and send it to a laboratory for a blood test. The laboratory can provide the specific concentration of specific troponin proteins per liter or milliliter of blood. Make sure to ask if the patient is taking vitamin B7 or biotin because this vitamin can make the levels of troponin seem lower.
### **Step 3: Use the normal levels chart as a reference**
After receiving the results of the lab test, start interpreting troponin levels using the table in the template, which contains normal values for both traditional and high-sensitivity troponin tests. Doing so will give you insight into the patient's immediate cardiovascular health. If you suspect a myocardial infarction, you may take additional steps such as a chest x-ray, an echocardiogram, an electrocardiogram, an angiogram, a cardiac CT scan, or a cardiac MRI to confirm your diagnosis, or you may start management and treatment right away.
**
### Step 4: Document the patient's troponin levels**
Use the allotted fields in the template to document the patient's troponin levels over the observation period. It contains a blank graph that you can assign your own axis labels and plot points onto. On the Y axis, place regular intervals for the measures. The X axis is for the days when the troponin test is done.
## **What do the values mean?**
After you receive the laboratory results, you can compare it with the following values to guide your medical decisions.
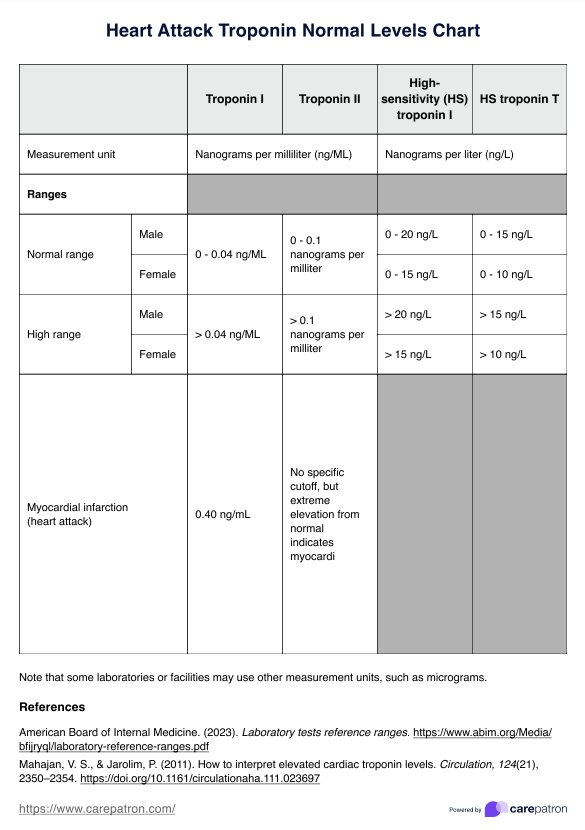
**Normal ranges:**
- Troponin I for male and female: 0 - 0.04 ng/mL
- Troponin T for male and female 0 - 0.01ng/mL:
- High-sensitivity cardiac troponin I for males: 0 - 20 ng/L
- High-sensitivity cardiac troponin I for females: 0 - 15 ng/L
- High-sensitivity cardiac troponin T for males: 0 - 15 ng/L
- High-sensitivity cardiac troponin T for females: 0 - 10 ng/L
Once the value of a specific troponin protein goes above these ranges, it is considered high. Once the troponin I goes above 0.40 ng/mL for both males and females, it is indicative of a myocardial infarction, especially if the patient is experiencing chest pain.
Urgent treatment is required if patients have a significant level of troponin T present in their bloodstream, as this is likely the result of a severe cardiac event. Abnormal troponin levels can also suggest other health issues, and the results should be considered with additional testing means, such as clinical and symptom assessment and an ECG.
## **Additional resources**
Looking for cardiovascular or heart-related resources or tools to use in your practice to enrich your knowledge or improve your patient care? Here are some you can download for free:
- [**Heart Failure Nursing Care Plan**](https://www.carepatron.com/nb-NO/templates/heart-failure-nursing-care-plan/#app-chapter-one): Deliver comprehensive care to individuals experiencing heart failure with the help of a heart failure nursing care plan template.
- [**Heart Attack Test template**](https://www.carepatron.com/templates/heart-attack/): Ensure a more accurate heart attack detection and treatment with a heart attack test template.
## **References**
An Overview of Troponin. (2024, July 10). Creative-Diagnostics.com. https://www.creative-diagnostics.com/an-overview-of-troponin.htm#:~:text=What%20Is%20Troponin?,the%20diagnosis%20of%20heart%20disease.
Babuin, L., & Jaffe, A. S. (2005). Troponin: the biomarker of choice for the detection of cardiac injury. Canadian Medical Association Journal, 1191–1202. https://doi.org/10.1503/cmaj.050141
Cleveland Clinic. (2022). Troponin test: What it is and normal range. https://my.clevelandclinic.org/health/diagnostics/22770-troponin-test
Cunha, J. P. (n.d.). 13 reasons for high-sensitivity troponin test, normal & high ranges (M. Conrad Stoppler, Ed.). MedicineNet. https://www.medicinenet.com/high_sensitivity_troponin_test_ranges_and_values/article.htm
Leite, L., Matos, P., Leon-Justel, A., Espírito-Santo, C., Rodríguez-Padial, L., Rodrigues, F., Orozco, D., & Redon, J. (2022). High sensitivity troponins: A potential biomarkers of cardiovascular risk for primary prevention. Frontiers in Cardiovascular Medicine, 9, 1054959–1054959. https://doi.org/10.3389/fcvm.2022.1054959
Michos, E. D., Berger, Z., Yeh, H.-C., Suarez-Cuervo, C., Wilson, L. M., Stacy, S., & Bass, E. B. (2014, August). Background. Nih.gov; Agency for Healthcare Research and Quality (US). https://www.ncbi.nlm.nih.gov/books/NBK241529/#:~:text=Troponin%20levels%20increase%20within%203,also%20have%20elevated%20cardiac%20troponin.&text=Non%2DACS%20conditions%20can%20include,can%20make%20an%20accurate%20diagnosis.
Stark, M., Kerndt, C. C., & Sharma, S. (2023). Troponin. In StatPearls. StatPearls Publishing. https://www.ncbi.nlm.nih.gov/books/NBK507805/
Tanindi, A., & Cemri. (2011). Troponin elevation in conditions other than acute coronary syndromes. Vascular Health and Risk Management, 597. https://doi.org/10.2147/vhrm.s24509
Commonly asked questions
When troponin I levels go above 0.04 ng/mL or troponin T goes above 0.01ng/mL for both males and females, it is already an indicator of heart damage. However, if it goes above 0.40 ng/mL, it is indicative of a probable myocardial infarction (heart attack) and should be considered an emergency.
A troponin level of 500 ng/L (which is equivalent to 0.50 ng/mL) is significantly elevated and typically indicates myocardial injury, most commonly associated with a myocardial infarction (heart attack).
Normal troponin levels are usually very low, often falling below detectable limits, but can be measured in nanograms per milliliter (ng/ml). Typically, the normal reference range for troponin levels is between 0 and 0.04 ng/ml.