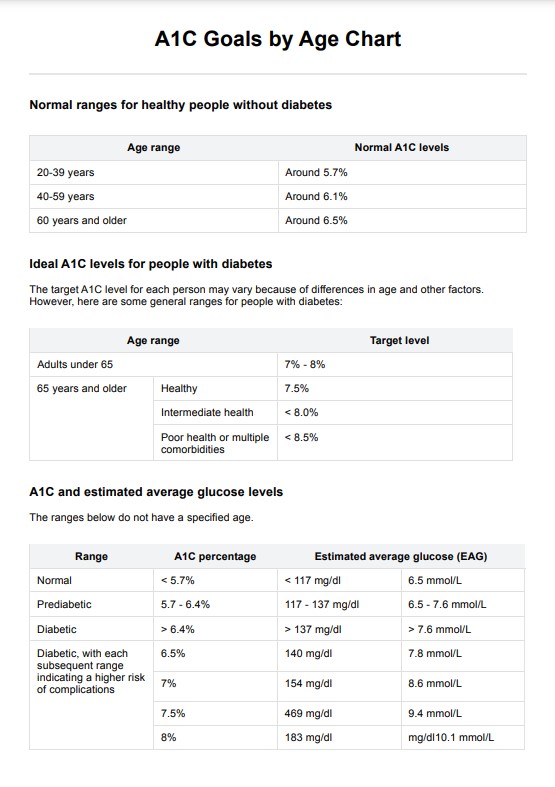
Printable A1C Chart

Use this printable A1C Level Chart to quickly and easily track your patient's A1C levels. Get access to a free PDF example to learn more.

By Ericka Pingol on Mar 06, 2024.

Fact Checked by Ericka Pingol.

Use Template

What is an A1C Level Chart?

An is used to monitor an individual's average blood glucose levels over three months. It is based on the A1C test, which measures the percentage of glucose-attached hemoglobin (HbA1c) in an individual's red blood cells. This test can provide an overall picture of a patient's blood sugar control and help healthcare providers make decisions about changes in diet, exercise, or medication.

This chart shows how well a person's diabetes management plan works. By tracking the A1C results over time, patients and healthcare providers can understand how successful certain treatments are and make necessary adjustments. It can also be used to monitor if an individual is at risk of developing diabetes-related complications such as heart disease, stroke, and kidney disease.

It's important to note that the A1C Level Chart is not meant to substitute for regular blood sugar monitoring or frequent doctor visits. It should be used in combination with other tools to get the most complete picture of a patient's diabetes management plan.

Printable A1C Chart

Download this A1C Chart to track your patient's A1C levels

How does this A1C Level Chart work?

Our free printable A1C Chart is quick and easy to use, allowing you to monitor your patient's A1C levels in minutes. Here's how to get started:

Step One: Download the chart

You can get a copy of the free template using the link on this page. Similarly, you can download it from the Carepatron app or the resource library.

Step Two: Collect your patient's data

You'll need the A1C test results from a lab or other medical provider. Compare your patient's A1C level to the chart and record it.

Step Three: Follow up with your patient

Review the results with your patient. If the A1C level is too high, develop a plan with them to lower it. Encourage your patient to follow the plan and set up periodic follow-up visits.

Step Four: Monitor progress

Keep track of the patient's progress over time. Adjust their diet or medication to get them closer to their goal A1 levels if necessary.

A1C Chart example (sample)

We've written an A1C Chart PDF example illustrating how this form works. It showcases how to compare a patient's A1C level against the chart and identify their risk level. You can view the sample here or download the PDF version.

Download the free A1C Chart example (sample)

A1C Chart example (sample)

When would you use this chart?

This printable A1C Chart can be used in various settings, including diabetes clinics and private practice consultations. You can also use it to:

Track a patient's progress over time

You can use an A1C Level Chart to assess a patient's progress and determine whether they are reaching their target A1C goals. This can give you insight into how well their diabetes treatment plan works.

Identify risk levels for pre-diabetes and diabetes

The A1C chart helps identify pre-diabetes and diabetes risk levels. It can help you determine when a patient should be referred for further testing or when lifestyle changes and medications may be necessary.

Compare the A1C results of different patients

You can utilize this form to compare the A1C results of different patients. This is a great way to see how well each patient's diabetes treatment plan works and if any adjustments are needed.

Educate patients about their A1C levels and risk actors

It's important to educate patients about their A1C levels and the risk factors associated with pre-diabetes and diabetes. By understanding what their A1C levels mean for their health, patients can make informed decisions about how to take better care of themselves and manage their diabetes.

Benefits of Free A1C Chart

The free A1C chart is an excellent tool for both healthcare providers and patients. Here are some of its advantages:

It's quick and easy to use

The chart includes all the information needed to assess and monitor a patient's A1C levels accurately, so there's no need for extra paperwork or calculations.

It's convenient and accessible

The free A1C Chart can be printed out or accessed online. You can use it anytime, anywhere, as long as you can access a computer or printer.

It's informative

This template includes key information about how to interpret A1C levels. It can be used as an educational tool, helping patients better understand their diabetes and how to manage it.

It's reliable

The free A1C chart is based on the same guidelines healthcare professionals use. This makes it a reliable source of information for tracking A1C levels and making decisions about patient care.

How to test A1C levels?

Commonly asked questions

How to test A1C levels?

A blood test is typically used to assess A1C levels. This involves taking a small blood sample and sending it to the lab for analysis.

What does A1C Chart measure?

The A1C Chart measures the average blood sugar levels over the past two to three months. It is a good way to track how well a patient is managing their diabetes and see how different treatments affect their blood sugar levels.

Is the A1C Chart reliable?

An A1C Chart is a reliable measure of average blood glucose control over the last two to three months. The chart is based on the same principles as the hemoglobin A1c test used in clinical settings and is recommended by healthcare professionals.

Join 10,000+ teams using Carepatron to be more productive

One app for all your healthcare work