The PROMIS Physical Function (PF) is scored using a T-score metric, which is derived from the responses provided by the patient. Each item's response is given a score, and these scores are summed and then converted into a T-score through a process that accounts for the question's difficulty and the calibration of the measure. This conversion often involves software or scoring tables specific to the PROMIS framework.
Promis Scoring
Introduce a systematic approach to evaluating patient health through the PROMIS measures and learn how to interpret its scores.

Use Template
Promis Scoring Template
Commonly asked questions
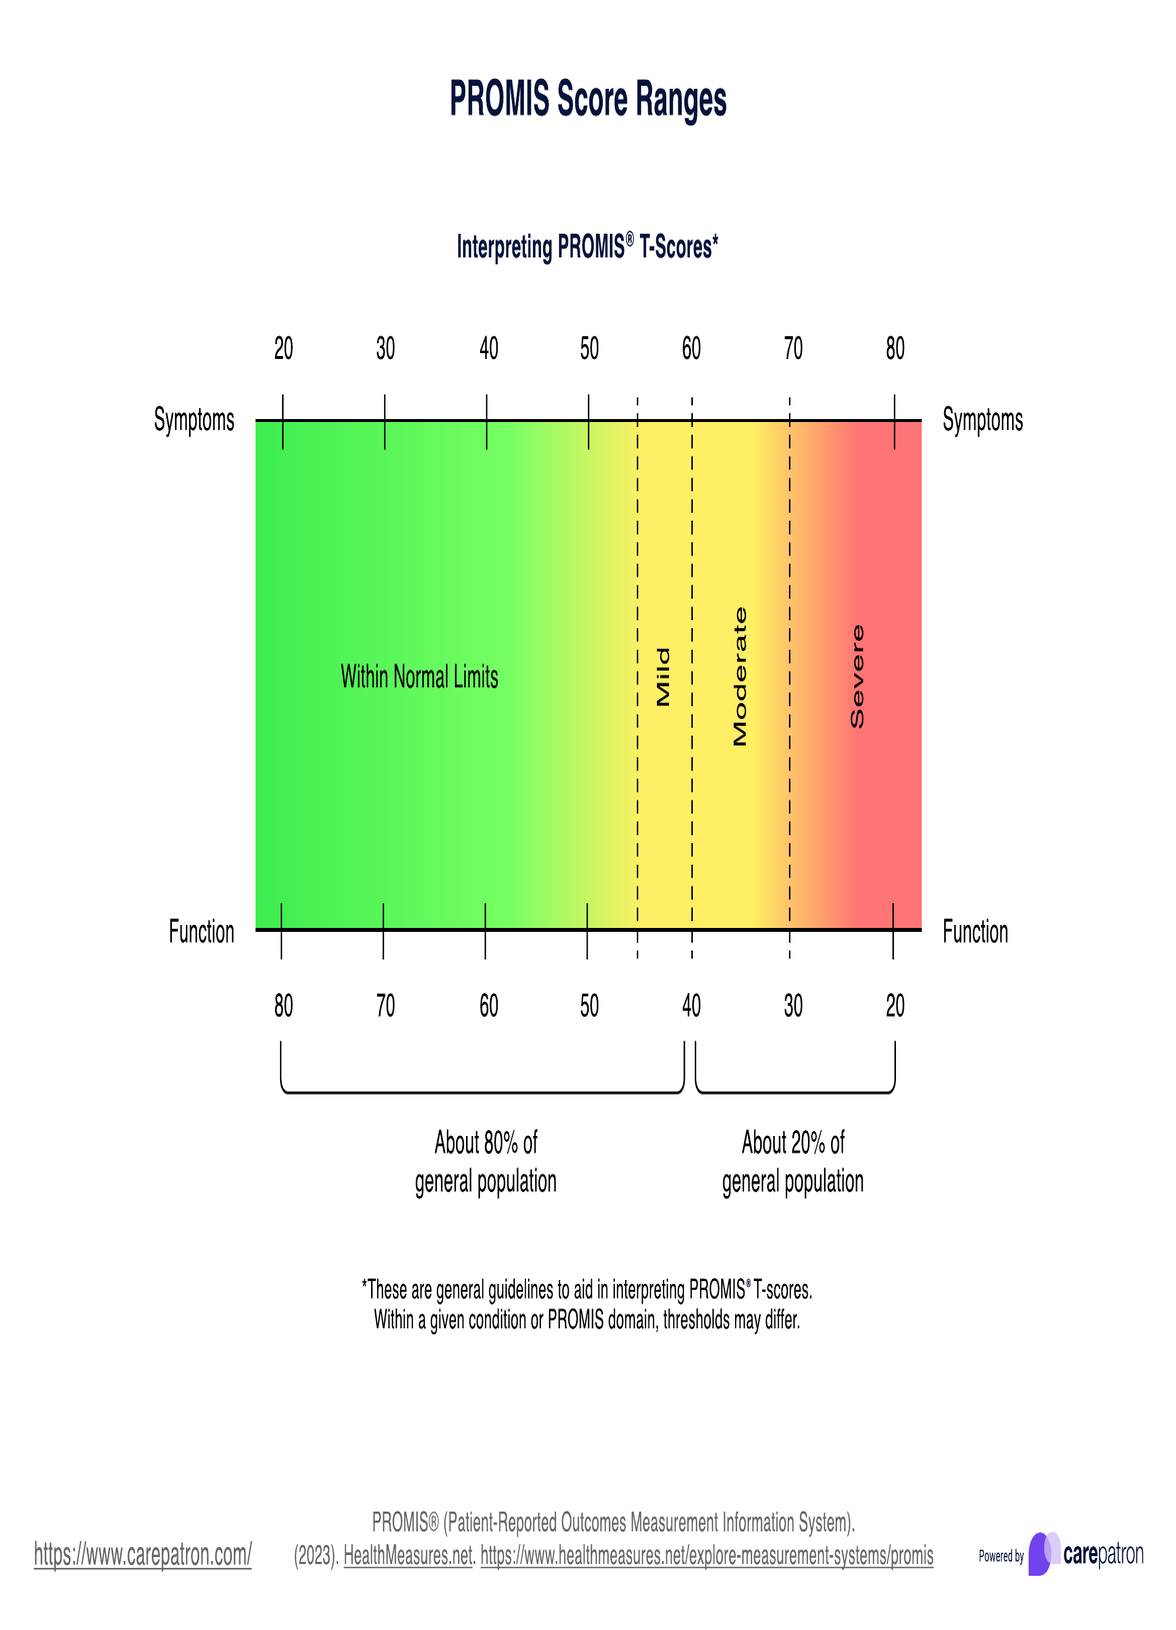
In PROMIS, a T-score metric represents a person's health status compared to a reference population with a mean (average) score of 50 and a standard deviation (SD) of 10. A T-score higher than 50 suggests better health status or function compared to the average, while a T-score below 50 indicates poorer health status or function.
A T-score metric is a standardized score that indicates where a person's score falls on a distribution relative to a reference population's mean and standard deviation. On the other hand, a percentile shows the percentage of the reference population that scores below a particular score. T-scores provide a direct comparison to the population mean and variability, while percentiles tell you the position of a score in relation to others in the population.


EHR and practice management software
Get started for free
*No credit card required
Free
$0/usd
Unlimited clients
Telehealth
1GB of storage
Client portal text
Automated billing and online payments