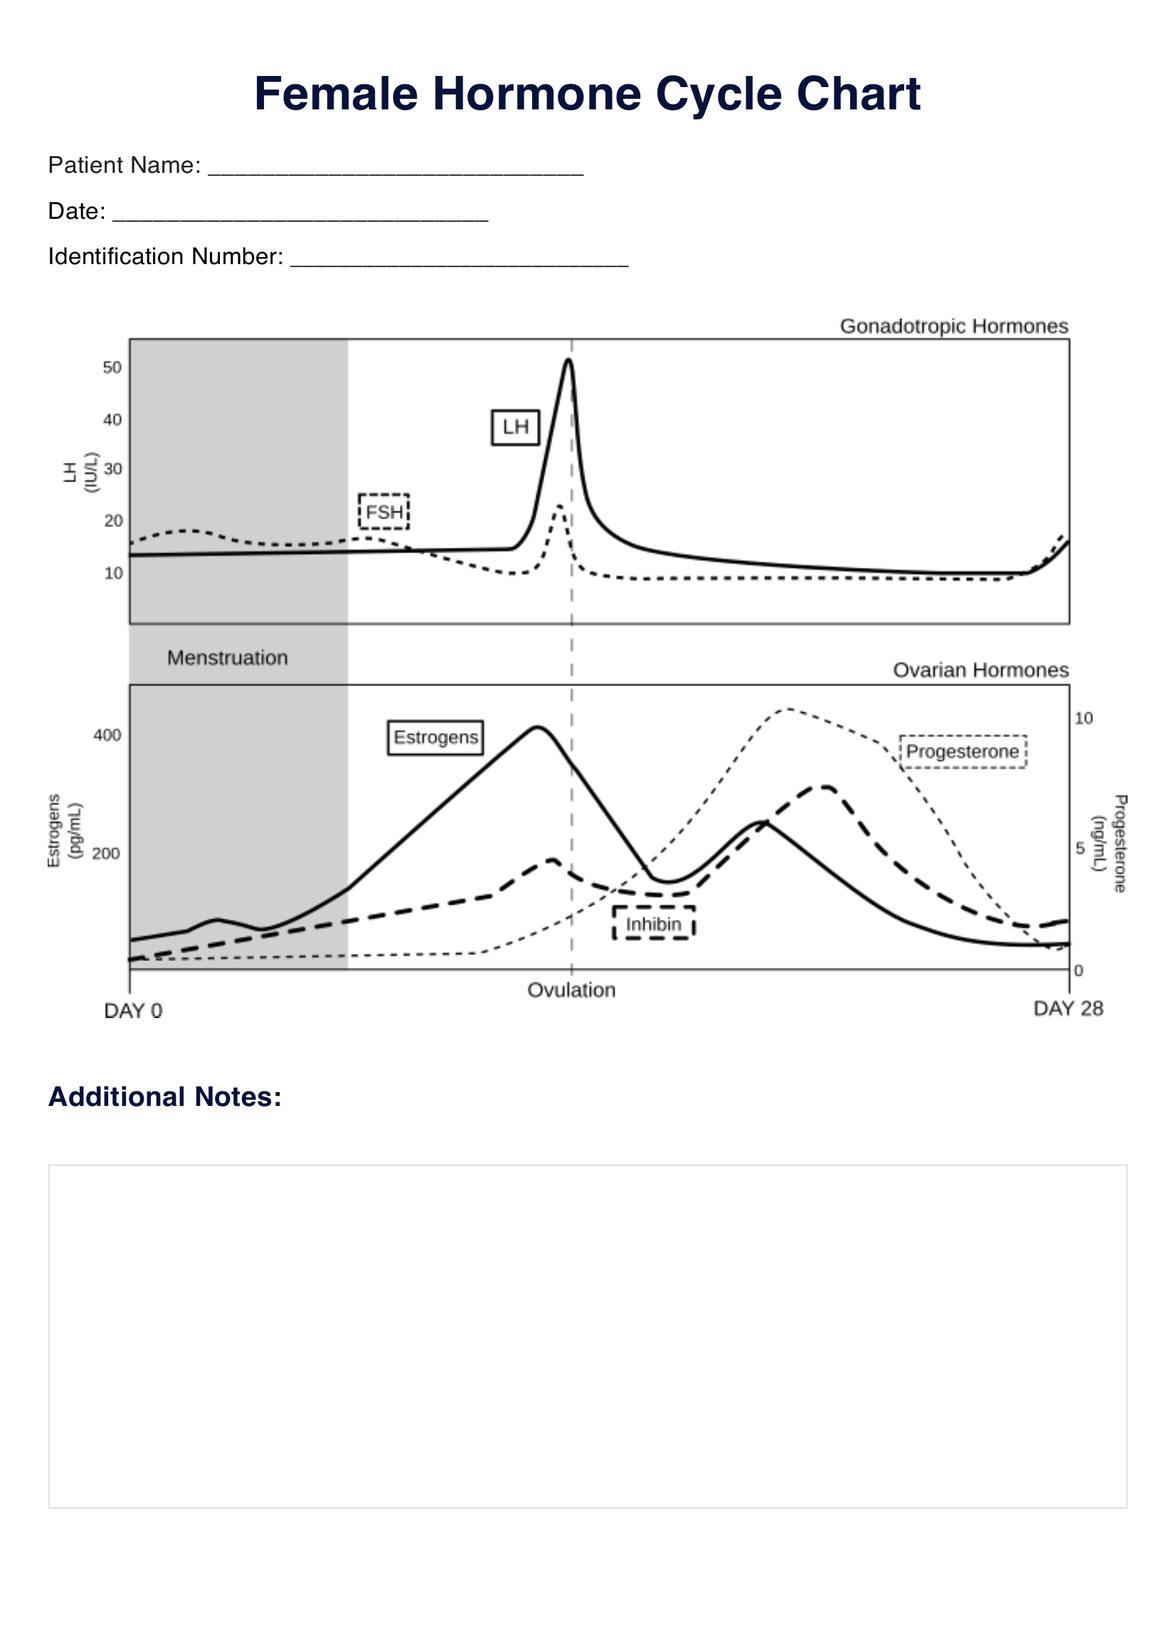
The x-axis of this chart represents time, and the y-axis is the concentration of each hormone. This chart can be used to understand better how each hormone varies in concentration throughout the 28-day cycle and how these variations lead to crucial events such as menstruation and ovulation.
Female Hormone Cycle
Our handy female hormone cycle chart shows the cyclic variations in ovarian and gonadotropic hormones in a single resource, perfect for revision or education.

Use Template
Female Hormone Cycle Template
Commonly asked questions
This female hormone cycle chart can be a great visual tool for teaching purposes. If your patients are struggling to understand how their hormonal birth control prevents pregnancy, or if you want to illustrate the female hormonal cycle to explain fertility, this chart can be a great help. While we have aimed to keep this resource simple and accessible, it is likely that this chart alone will be insufficient to explain the complexities of the female reproductive cycle fully and is best used as a supplementary tool.
There are many hormones involved in the regulation of the female reproductive cycle, including gonadotropic hormones secreted from the anterior pituitary, as well as ovarian hormones. This chart illustrates follicle-stimulating hormone (FH) levels, luteinizing hormone (LH), estradiol, inhibin, and progesterone.


EHR and practice management software
Get started for free
*No credit card required
Free
$0/usd
Unlimited clients
Telehealth
1GB of storage
Client portal text
Automated billing and online payments