Menstrual Cycle HormoneAI Template IconToolbar IconShare Icon

Menstrual Cycle Hormone

Our simple menstrual cycle hormone chart graphically depicts female reproductive hormone concentrations throughout a 28-day cycle.

Alex King avatar

By Alex King on Aug 2, 2025.

Fact Checked by Nate Lacson.

Use Template

Menstrual Cycle Hormone Template

Download PDF Template

Commonly asked questions

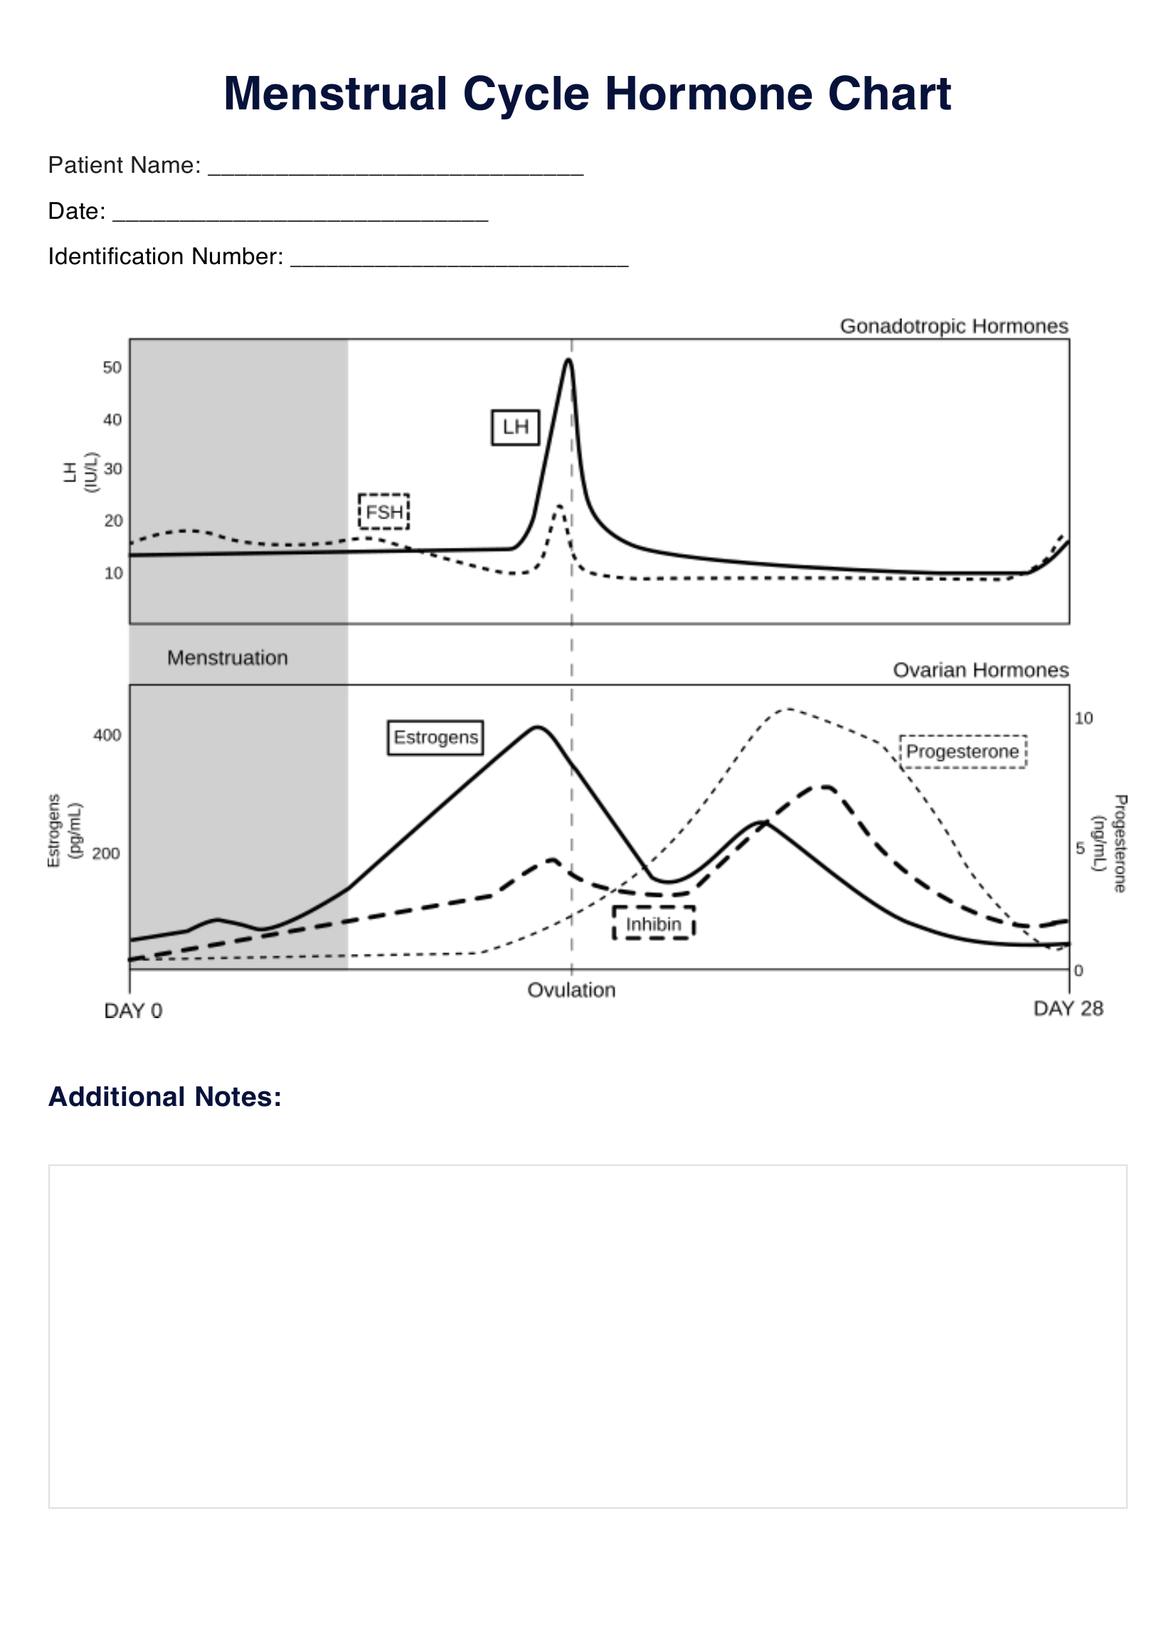
This chart's horizontal axis (x-axis) denotes time, while the vertical axis (y-axis) represents the relative concentrations of each hormone. This graphical representation aids in comprehending the fluctuations in hormone levels throughout the 28-day cycle, shedding light on pivotal events like menstruation and ovulation.

This visual aid will prove highly effective for educational purposes. It serves as a valuable tool for patients struggling to grasp how hormonal birth control functions in preventing pregnancy or for healthcare professionals looking to elucidate the intricacies of the female hormonal cycle concerning fertility. While we've designed this resource to be user-friendly and accessible, it's worth noting that it may serve best as a supplementary, more stylized tool, as it does not comprehensively cover all aspects of the female reproductive cycle.

The regulatory cascade of the female reproductive cycle involves many hormones, including gonadotropic hormones released from the anterior pituitary and ovarian hormones. This chart depicts explicitly follicle-stimulating hormone (FH) levels, luteinizing hormone (LH), estradiol, inhibin, and progesterone.

EHR and practice management software

Get started for free

*No credit card required

Free

$0/usd

Unlimited clients

Telehealth

1GB of storage

Client portal text

Automated billing and online payments